FieldNotes - Software familiarisation
This help page describes the overall layout and main features of your FieldNotes software.
The FieldNotes User Interface
When you use FieldNotes for the first time, the database-setup wizard will start automatically and guide you through the initialisation steps.
After initialisation is complete (and subsequently every time you start FieldNotes) the application will appear as shown below.
FieldNotes - Interface components
| Menu-bar (menus) |
| Tool-bar (tools) |
| Task bar (modes) |
| Status bar (program status information) |
| Session log |
| Errors log |
Three main sets of tools are used to control FieldNotes (described separately in the sections below):
-
the menu-bar allows access to the full range of program functions, including a number of less-frequently used options;
-
the tool-bar provides rapid access to core functions - record-entry, record-viewing, report-creation and help documentation, and;
-
the task-bar switches between different display modes (logs, data, maps), providing access to relevant functionality.
Additionally:
-
the status-bar displays information about the current action.
The:
-
Session log and
-
Errors log windows show information about session activities - these are displayed in Session mode.
2. The Tool-bar
The Tool-bar contains a subset of FieldNotes tools, chosen to allow wildlife Observations (and other records) to be entered, reviewed and documented quickly and easily.
FieldNotes - Tool-bar components
 Tool Options
| Tool | Notes |
| 'Add' | Add a new record (currently selected table) |
| 'Browse' | Edit an existing record (currently selected table) |
| 'Table selector' | Select table for current operation |
|
| 'Report' | Create a single-page report |
| 'Web Report' | Create a multi-page report |
| 'Map Report' | Create a map-based report |
|
| 'Save' | Save the database |
| 'Stop' | Interrupt the current operation |
| 'Help' | Display manual / help documentation |
The function of each of these tools is described below.
2.1. 'Add' Button
The 'Add' button opens the data-input form, allowing you to start recording your latest observations quickly.
The action of the 'Add' button is modified by whatever value is currently selected in the table-selector tool (eg. Observations), so that you can quickly switch between adding wildlife observations, site descriptions or other records.
2.2. 'Browse' Button
The 'Browse' button displays the first data record from whichever table is currently selected in the table-selector (eg. Observations).
The record form subsequently allows you to step through records viewing their content.
The action of the 'Browse' button is modified by whatever value is currently selected in the adjacent table-selector tool (eg. Observations), in an similar way to the 'Add' button.
2.3. Table Selector Observations
The Table-selector tool determines the type of records that you are currently working on, allowing you to quickly switch between different tables (Observations, Surveys, Sites, Localities, Contacts, Recorders, Organisations, Checklists or Bibliography) for entering or browsing data.
2.4. 'Report' button
The 'Report' button creates a single-page report (in a Microsoft Word-compatible format), using wildlife observations and site descriptions in your database.
Various aspects of the report, including the content (records may be selected for inclusion / exclusion) and level-of-detail may be defined in the 'Report Wizard' dialogs (described in more detail in FieldNotes Tutorial 2.7 - Creating a Report).
2.5. 'Web-report' button
The 'Web-report' button generates a multi-page report (in HTML-format) suitable for publishing on your intranet or website.
Each Wildlife observation and Site Description is described on a separate web-page, which are linked from summary lists for easy reference.
Various aspects of the report, including content and level-of-detail, may be defined the 'Web-report Wizard' dialogs (described in more detail in FieldNotes Tutorial 2.8 - Creating a Web Report).
2.6. 'Map-report' button
The 'Map-report' button generates a single-page map-based report (in HTML-format) suitable for publishing on your website.
Locations of wildlife observations and sites are displayed using online map resources.
2.7. 'Save' button
The 'Save' button saves the current state of your FieldNotes database, ensuring that any information that you have entered is stored safely on your computer.
2.8. 'Stop' button
The 'Stop' button interrupts the current process. This allows you to curtail lengthly operations, for example, a report based on an invalid dataset.
2.9. 'Help' button
The 'Help' button displays the FieldNotes help documentation in your web-browser.
3. The Task-bar (and Display modes)
FieldNotes is much more than a program for entering observation data - it also allows you to carry out a full range of processes including checking and reviewing your records, filtering subsets of data and creating maps and reports.
The task-bar provides the key to switching between different modes:
-
Session mode - summarises your activities, and associated errors or warnings
-
Data mode - displays selected data records in a single-line (worksheet-style) format
-
Map mode - plots selected data records on a map
The task-bar allows you to switch between analytical and display modes quickly (for example when selecting a subset of your stored data for plotting).
FieldNotes - Taskbar components
 Task Modes
| Task | Notes |
| 'Session' | View activity and error logs for the current session |
| 'Data' | View your records in worksheet (single-line) format |
| 'Maps' | Create a map using selected data |
| 'Calendar' | Set the Calendar Tool |
| 'Images' | Start / pause the picture panel |
These tasks are described separately below.
3.1. 'Session' Mode
Selecting the 'Session' button on the task-bar displays the data-log (in the upper portion of the Session window) and error-log (lower smaller portion of the Session window) for the current FieldNotes session.
FieldNotes 'Session' mode (data-log / error-log display)
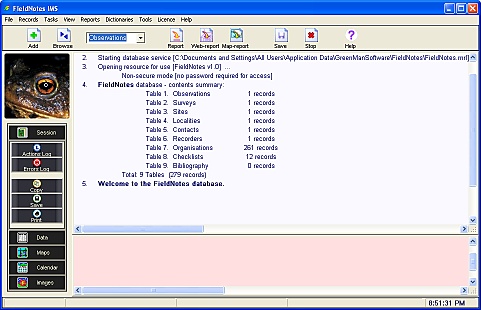
The data-log summarises activities from the current session, including a detailed description of input data fields.
The error-log lists any errors or warnings that have been generated during the current session.
The Session Mode Help page describes the functions available in 'Session' mode in more detail.
3.2. 'Data' Mode
Selecting the 'Data' button on the task-bar displays records from the current database table in worksheet format (one record per line).
FieldNotes 'Data' mode (worksheet display)
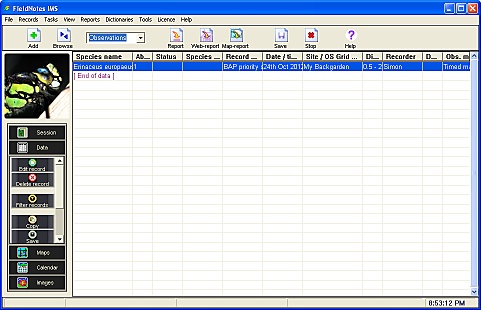
Initially the 'Data' window displays records in the 'Observations' table.
You can use the table-selector tool ( on the FieldNotes tool-bar) to view data in any of the other tables (Observations, Surveys, Sites, Localities, Contacts, Recorders, Organisations, Checklists or Bibliography).
Tip - empty Worksheet display
If you are new to
FieldNotes and have not yet entered any wildlife Observations, you will see an empty worksheet display when you first explore the 'Data' mode.
Try changing the table-selector tool on the tool-bar to
Organisations to view some pre-loaded data.
The Data Mode Help page describes the tools and functions available in 'Data' mode in more detail.
3.3. 'Map' Mode
Selecting the 'Map' button on the task-bar sets the view window to Map mode, allowing you to plot selected data records as a map.
FieldNotes 'Map' mode (map creation)
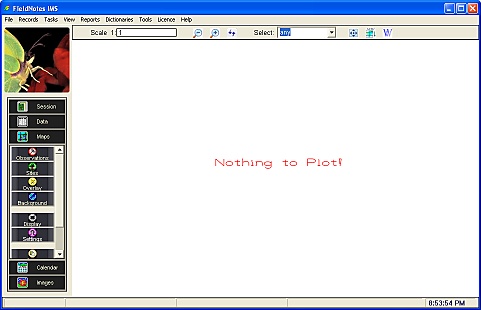
Initially no data records are selected, and the map window is blank with a message to this effect.
The Map Mode Help page describes the tools and functions available in 'Map' mode in more detail.
3.4. Calendar tool
Selecting the 'Calendar' button on the task-bar opens the Calendar window.
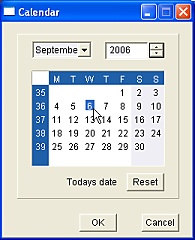 FieldNotes
 interface:
The Calendar Tool.
The Calendar tool allows you to set a default date (in the past) for the current FieldNotes session.
This is particularly useful if you are entering a number of Observations from a recent outing, as it avoids the need to change the date field each time you add a new record.
The Calendar Tool is also used in a number of data-entry forms - see the Calendar Tool Help page for further information.
3.5. 'Image' Tool
The Picture panel displays a random sequence of some of our more vivid plants, animals and fungi (to enliven the more tedious data-entry processes).
Clicking anywhere on the Picture panel will provide a brief description of the species and context of the photograph.
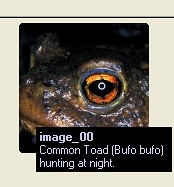 FieldNotes
 interface:
The Picture panel.
Selecting the 'Image' button on the task-bar toggles the Picture panel between active / static modes.
The Picture Panel Help page includes further information about using the Picture panel.
4. The Status-bar
The Status-bar is aligned along the bottom of the window and is visible in all work modes.
The Status-bar does not contain any tools, but provides information relating to the current task.
FieldNotes - Status-bar fields

For example, in 'Map' mode the fields show the OS Grid coordinates and latitude/longitude position of the cursor and the location of picked point; in 'Data' mode the status-bar fields show creation / updated information for selected records.
