FieldNotes - Map Mode
The FieldNotes interface allows you to view your data in a number of different ways:
-
Session mode - summarises your activities with associated errors and warnings
-
Data mode - displays selected records in a single-line (worksheet-style) format
-
Map mode - displays selected data as a map
This document describes aspects of working in Map mode.
For details of how to use other work modes, refer to the FieldNotes overview help page.
Switching to Map mode
To use Map mode, select the 'Maps' button on the Task-bar (or use the menu option).
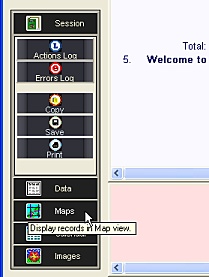
Selecting Map mode
from the Task-bar.
The display is updated to a map format, together with a relevant set of subtask buttons:
FieldNotes Map mode (map display).
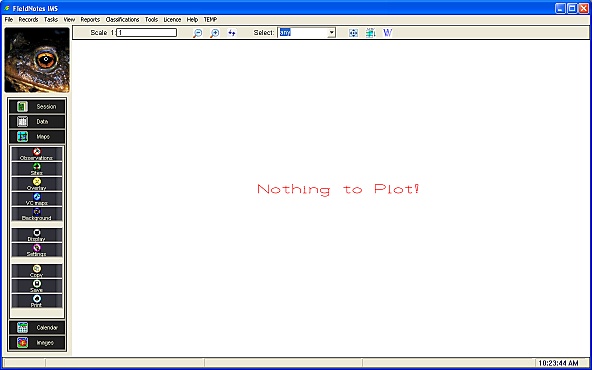
Tip - empty Map display
Initially the map window does not contain any data - you will need to specify a dataset to be displayed.
Working in 'Map' Mode
Although the FieldNotes Map window can be used simply as a means of visualising your Observations (and Sites) datasets, it also offers a great deal more flexibility by:
-
displaying selected subsets of your data;
-
being able to handle multiple datasets;
-
displaying Overlaid dataset (imported from external files);
-
displaying background maps and tiles;
-
allowing plotted records to be examined, by picking;
and generally through handling the data as a series of layers, in a similar manner to Geographical Information systems (GIS).
The Map window tools may be split into two main groups:
-
general tools for manipulating the entire map (the Map tool-bar), and;
-
more specific tools for working with datasets and layers (the Map sub-tasks).
These are described separately in the sections below.
1. The Map toolbar
In Map mode a second tool-bar is displayed, aligned along the top of the map area:
FieldNotes Map tool-bar.

The Map tool-bar provides a specific set of functions that apply to the map window:
| Tool | Notes |
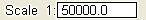 | Map Scale | View / Set the map scale |
|
 | Zoom in | Zoom in to the map - increase the scale by a factor of two |
 | Zoom out | Zoom out of the map - decrease the scale by a factor of two |
 | - Redraw | Redraw the map |
|
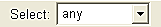 | Layer Selection | Choose which data layer responds to picking on the map |
|
 | Reset | Reset the map scale / centre to display all records |
 | Frame | Switch between non-framed / framed map view |
 | Web | Create a Web-based map (using Online map resources) |
Tip - enlarging the map area
If you wish to maximise the size of the map window, press the
F10 key to hide the task-bar area and
F11 key to hide the
FieldNotes tool-bar.
Press
F10 and
F11 again to restore the original view.
2. Plotting your data records
In Map mode, the task-bar includes the following set of sub-tasks:
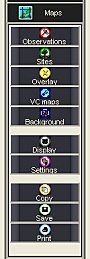 FieldNotes Map mode - sub-tasks
| Sub-task | Notes |
| Observations | Specify a set of Observation records to plot |
| Sites | Specify a set of Site records to plot |
| Overlay | Load a set of Overlay records (from an external file) to plot |
| VC Maps | Display the Vice-county map for your area |
| Background | Load a background map (from an external file) |
|
| Display | Choose which datasets to display on the map |
| Settings | Update the Map drawing settings |
|
| Copy | Copy the map image to the clipboard |
| Save | Save the map to a file |
| Print | Print the map |
The function of these sub-tasks is described below.
1.1 Plotting Observation data
FieldNotes allows any number of subsets of your Observation data to be plotted simultaneously in the Map window (for example you may decide to plot Great Crested, and Common and Palmate Newts separately on a single map of amphibians in your area), by including a selection filter with the plotted data.
Each Observations dataset for display requires just two inputs:
-
A unique name for the dataset (suitable default supplied), and;
-
A data-selection filter, to choose which records will be displayed.
The resulting form for adding a new Observations dataset to the map is very simple:
The 'New Observations dataset' form.
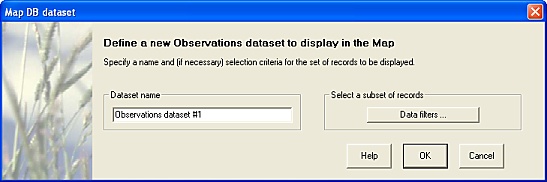
The Data filters button opens the form for specifying data-selection criteria (filters).
The Data filters form is common to many FieldNotes processes - its functionality is described with general tools.
If no selection criteria are specified, all Observations will be plotted on the map.
Tip - preloading data into 'Map' mode
Maps are always created empty, so that you can select the subset of Observations and Sites that you wish to plot.
To create a map with a predefined set of Observations, use the
Map sub-task in
Data mode.
2.2 Plotting Site data
Again, FieldNotes allows multiple subsets of your Site data to be plotted simultaneously in the Map window, by including a selection filter with the plotted data.
Each Site dataset for display requires just two inputs:
-
A unique name for the dataset (suitable default supplied), and;
-
A data-selection filter, to choose which records will be displayed.
The form for adding a new Sites dataset to the map is:
The 'New Sites dataset' form.
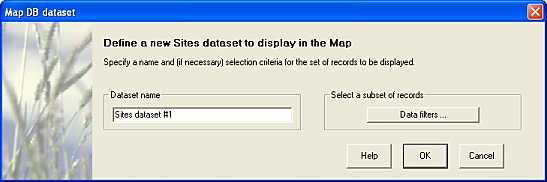
The Data filters button opens the form for specifying data-selection criteria (filters).
The Data filters form is common to many FieldNotes processes - its functionality is described with general tools.
If no selection criteria are specified, all Sites will be displayed on the map.
2.3 Plotting Overlay data
Overlay datasets are simple data-points (with accompanying labels) which may be loaded from an external file and 'overlaid' on the map of your own records.
Overlay datasets are useful for including such information as third-party observations, markers, features or other related data in maps.
FieldNotes allows any number of Overlay datasets to be plotted simultaneously in the Map window.
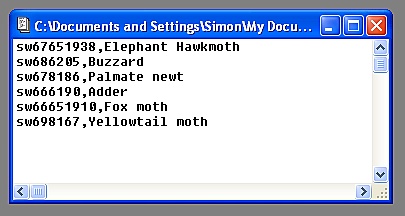
Overlay data are loaded from ASCII (plain text) comma-separated files with the following format:
| OS Grid reference |
Text (use double quotes if text includes commas) |
OS Grid reference may be specified from 4-figure to 10-figure precision; there is no restriction on the length of the label text.
Overlay dataset file example.
Each Overlay dataset requires the following inputs:
-
The path of the Overlay data file;
-
A unique name for the dataset (suitable default supplied), and;
-
A data-selection filter, to choose which records will be displayed.
The 'New Overlay dataset' form.
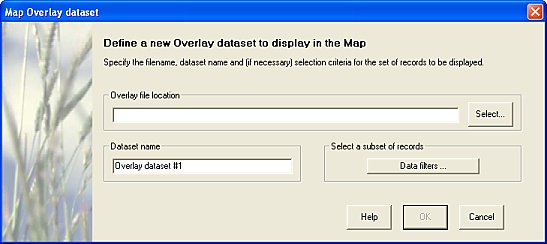
The Data filters button opens the form for specifying data-selection criteria (filters).
The Data filters form is common to many FieldNotes processes - its functionality is described with general tools.
If no selection criteria are specified, all Overlay data will be plotted on the map.
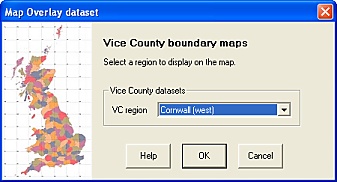
2.4 Displaying Vice County boundaries
Vice Counties are recognised regions of the UK and Ireland (approximately half the size of a county - hence their name) used for compiling wildlife information.
VC boundaries provide a useful frame of reference when creating maps, and can be used to place your own observations in a universally recognised context.
FieldNotes software includes high-definition Vice County map data and allows a number of VC maps to be drawn simultaneously in the Map window.
To display Vice County boundaries for the area relevant to your observations, simply choose each Vice County name from the drop-down list:
The 'VC Maps' form.
The VC boundary map files are provided in MIF format, which defines not only the spatial coordinates but also the colours and line/fill styles used for display.
To change the colour, thickness and style of boundary lines and regions you will need to take a copy of the relevant VC Map file and edit it (the MIF file format is described in the "MapInfo MIF/MID Format" document available on the internet).
The VC Map files used by FieldNotes are located are located in the "fnresources\maps" folder associated with the FieldNotes executable file.
Alternatively your own VC boundary datasets may be loaded in the same manner as Background maps (see 2.5 below).
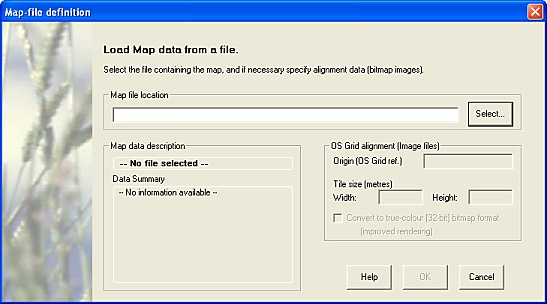
2.5 Adding Background Maps
Background maps add context to your data by including local features and other landscape information.
Map tiles (bitmap images) or linear feature (vector data) maps can be used as a background for your observations.
FieldNotes allows a number of background maps to be loaded from external files and drawn simultaneously in the Map window.
Background maps may be loaded from files in the following formats:
| Map Tiles (bitmap image) | Unencrypted Bitmap format (.bmp, .dib) |
| Vector maps (ascii data files) | MIF-format data |
The different types of background maps require different inputs:
-
Bitmap images - file name, origin, scale (origin and size are interpretted from the filename - use OS Tile-naming format wherever possible)
-
MIF-format images - file name only (all spatial information is provided in the file).
The 'New Background Map' form attempts to recognise the file-type as soon as a file name is specified, and prompts automatically for relevant values:
The 'New Background Map' form.
UK map data suitable for use with FieldNotes software may be obtained from a number of sources.
-
The Ordnance Survey provide UK maps in a range of formats free under their Open Data licence, and also sell many of their large-scale maps (directly equivalent to the "Explorer" range) in bitmap format, known as OSTiles.
More information on these and a number of additional map data sources are listed on the FieldNotes Resources page.
2.6 Changing the datasets that are displayed on the Map
The Display subtask button opens a set of forms which allow the displayed datasets to be selected.
Display forms allow you to switch datasets and background maps 'on' or 'off' - a useful feature for exploring patterns in the data or preparing maps for publication.
FieldNotes Map Display - Observations form.
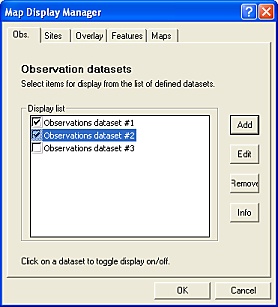
Five sub-forms are available listing Observation, Site, Overlay, Feature and Background Map datasets respectively.
Each dataset loaded into the Map is listed in the appropriate form together with a checkbox indicating whether it is currently displayed.
Selecting a dataset toggles the display between on/off states, with corresponding effects on the map when redrawn.
2.7 Changing the Map display settings
The Settings subtask button opens an extensive set of forms which allow a range of map parameters to be specified.
FieldNotes Map Settings - General form.
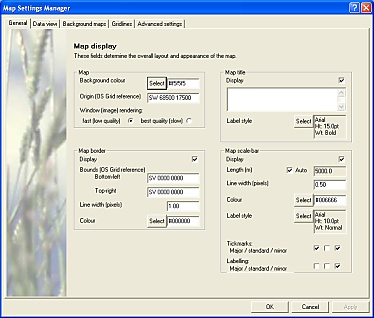
Map settings are grouped into the following categories, affecting different aspects of how the map is displayed:
-
General - the overall 'look and feel' of the map (background colour, title, borders, scalebar etc.)
-
Data view - how datasets are displayed (marker types, fonts, included text etc.)
-
Background maps - how background maps are displayed (borders, labels, bounds etc.)
-
Gridlines - how gridlines are drawn (frequency, width, colour, labelling etc.)
-
Advanced settings - picking precision, latitude and longitude models, advanced map display settings, etc.
See the FieldNotes Map settings help pages for further information about using these settings.
2.8 Copying the Map
The Copy subtask button copies the current map to the clipboard as a bitmap image.
The clipboard data may be pasted into many text-editors and image-processing applications using CTRL+V (control and V keys).
2.9 Saving the Map
The Save subtask button saves the current map as a file in one of the following common image formats:
-
BMP/DIB (bitmap image) - output map as a Windows bitmap image
-
JPG (jpeg image) - output map as a fully compliant JPEG/JFIF image
-
Web page (HTML) - output in HTML format as a simple web-page, containing the map with an explanatory header.
When saving a map as an image file (bitmap or jpeg formats), FieldNotes provides an option to resize the image during the output process.
By increasing the size for the output image, FieldNotes can be used to create publication-quality maps suitable for reports and articles.
FieldNotes FieldNotes 'Save Map' form.
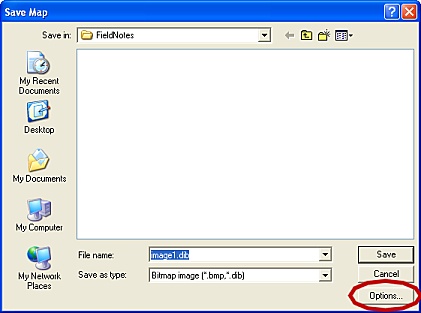
The 'Save Map' form includes a Options button with advanced settings.
Selecting the Options button opens a further form with fields for specifying the output image size.
FieldNotes 'Save Map' - Advanced Options.
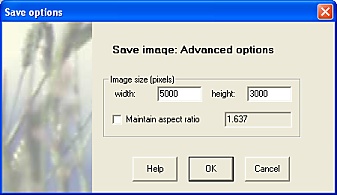
It is recommended that the image aspect (width:height) ratio of the final image is not altered, as otherwise the map will apear distorted.
There is no upper limit on the output image size, other than the memory constraints imposed by your computer.
2.10 Printing the Map
The Print subtask button prints the current map.
3. Picking from the Map - the Statusbar
When any dataset is displayed in the Map window, the status-bar fields show OS Grid coordinates and latitude/longitude information for both cursor position and picked points.
Map mode - Status-bar information.

'Picking' (ie. double-clicking) any data points on the map displays summary information about the relevant data record in a popup window.
The 'Layer selection' tool in the map tool-bar may be set to restrict picked points to a specific data layer.