FieldNotes - Data Mode
The FieldNotes interface allows you to view your data in a number of different ways:
-
Session mode - summarises your activities with associated errors and warnings
-
Data mode - displays selected records in a single-line (worksheet-style) format
-
Map mode - displays selected data as a map
This document describes aspects of working in Data mode.
For details of how to use other work modes, refer to the FieldNotes overview help page.
Switching to Data mode
To use Data mode, select the 'Data' button on the Task-bar (or use the menu option).
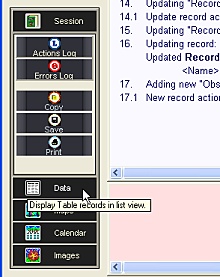
Selecting Data mode
from the Task-bar.
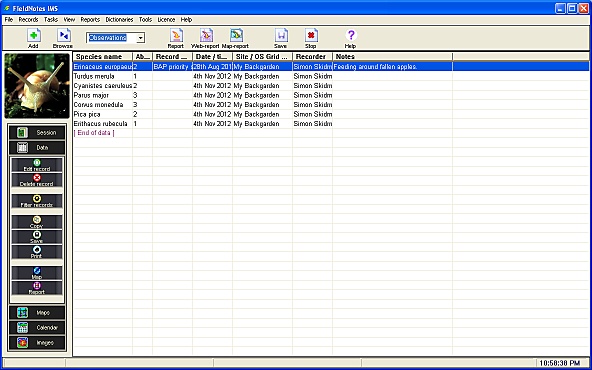
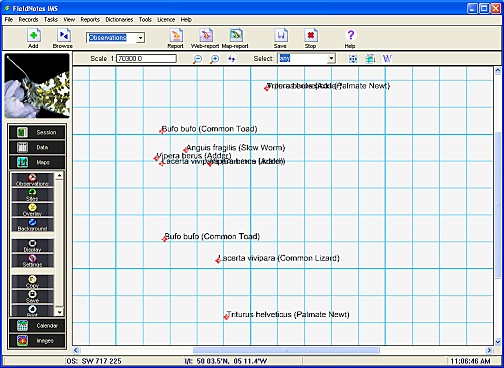
The display is updated to a worksheet format (one record per line), together with a relevant set of subtask buttons:
FieldNotes Data mode (worksheet display).
Tip - empty Worksheet display
If you are new to
FieldNotes and have not yet entered any Wildlife Observations, you will see an empty worksheet display.
Try changing the selector tool on the tool-bar to
Organisations to view some pre-loaded data.
Working in Data Mode
1. Viewing your Data
Information is stored in your FieldNotes database in a number of different tables (for example, all your Observations are stored together, regardless of their content).
Data mode displays the contents of a single table with one record per line, allowing you to examine and compare field values.
1.1 Viewing different sets of stored data (Tables)
Use the selector tool on the tool-bar (initially set to Observations) to choose which table records are displayed in Data mode.
Selecting different tables will update the window with the appropriate data records.
| Table name | Contents |
| Observations | Your wildlife observations |
| Surveys | Surveys you are involved in |
| Sites | (Named) sites - places where you regularly watch wildlife |
| Localities | The localities that you record in |
| Contacts | People who you know through wildlife recording |
| Recorders | Associates (contacts) who record wildlife in your area |
| Organisations | Organisations and associations relevant to wildlife recording
(includes preloaded data) |
| Checklists | Mini-lists of species that share a common feature
(includes preloaded data) |
| Bibliography | Books, magazines and articles about wildlife |
If the table contains more records than will fit in the worksheet window, use the scroll-bar on the right of the worksheet window to move up and down through the table contents.
Tip - enlarging the worksheet area
If you wish to maximise the number of records that you can view simultaneously in the 'Data' worksheet, press
F11 to hide the tool-bar area.
Pressing
F11 again will restore the tool-bar to view.
Table records are initially listed in alphabetical order, generally by the first column.
Click on a column-header to rank the records by the relevant column.
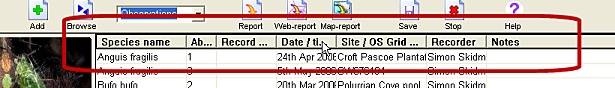 FieldNotes
 Data mode - selecting the (Date/time) column header for ranking data.
1.2 Viewing separate fields
In the Data mode each record is displayed on a single line, with the separate fields delimited by faint grey lines.
Depending on which table is being viewed (and what level-of-detail you are using), some of the fields in a table may lie beyond the right-hand edge of the worksheet and may not be displayed.
Use the scroll-bar to scroll the worksheet display left and right in order to review all field values.
Tip - viewing relevant field information
FieldNotes allows you to enter field observations at different levels of detail (quick, standard or detailed) depending on your recording preferences.
Viewing your data records in Data mode makes more sense if you use the same 'Level-of-detail' setting that you used when entering the data - otherwise your record may include a number of empty fields or hide relevant information.
(Level-of-detail is controlled from the menu).
If a field contains too much information to be displayed in the relevant region, it will be truncated at the right-hand border.
To increase the size of a field (in order to display more of the contents), drag the edge of the field on the table-bar to resize the field width.
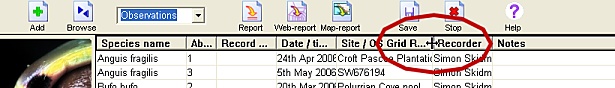 FieldNotes
 Data mode - increasing the size of a field by dragging the column header-bar
Tip - converting latin names to common names
To avoid ambiguity, species are listed by latin name in the 'Observations' table. If you need common name information, hover your mouse over the column containing the latin name to display table-tips with the relevant common name.
The table-tips disappear automatically after about 20 seconds.
1.3 Reviewing Record data (Browsing records)
Records displayed in Data mode can be viewed in the context of the original data-entry form without fear of changing the contents by:
-
picking a record in the worksheet window (click on it - the record will be highlighted), then;
-
selecting the 'Browse' button (on the tool-bar).
The selected record is displayed in the data-entry form.
Note that the Help, Save and Cancel at the bottom of the data entry form are replaced by <Prev, Next> and End buttons with the following functions:
-
<Prev - display the previous record (ranked in worksheet order, with filtering)
-
Next> - display the next record (ranked in worksheet order, with filtering)
-
End - close the data-entry form.
Tip - browsing records is always safe!
When browsing records you cannot update the record data in any way - any changes you accidentally make will not be saved.
2. Processing your data records
The task-bar includes the following set of sub-tasks that apply to Data mode:
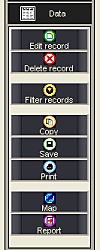 FieldNotes Data mode - sub-tasks
| Sub-task | Notes |
| Edit Record | Update information in a record |
| Delete Record | Delete a single record |
|
| Filter Records | Select a subset of the worksheet data |
|
| Copy | Copy worksheet data to the clipboard |
| Save | Save the worksheet data to a file |
| Print | Print the worksheet |
|
| Map | Create a map from the worksheet data |
| Report | Create a simple report from the worksheet data |
The function of these sub-tasks is described below.
2.1 Updating Record data (Editing records)
Records displayed in Data mode may be updated in the context of the original data-entry form by either:
-
picking a record in the worksheet window (click on it - the record will be highlighted), then selecting the 'Edit' sub-task button, or;
-
double-clicking on any record in the worksheet window.
The selected record is displayed in the original data-entry form.
Update the required fields in the data-entry form - then use the OK button to save the record with the updated information, or Cancel to discard the changes you have made.
The relevant field information in the worksheet view will be updated to show the changes.
2.2 Deleting Records
Records displayed in Data mode can be quickly deleted from the database by:
-
selecting the record (by clicking on it), then;
-
using the 'Delete' taskbar button.
Tip - be certain before deleting records!
Once a record has been deleted from your
FieldNotes database it cannot be restored.
Double-check with all database users that the information is no longer required before deleting records, and make regular backups of your data.
2.3 Filtering Records
Sometimes it is easier to compare records when only the subset that you are interested in are displayed.
For example, you may wish to examine records for one particular species in your database, to target areas where they are absent.
The Filter tool allows you to exclude or include individual data records, using selection criteria based on field-contents, in order to display a useful subset of your data.
Records which are not shown due to filter settings are not removed from the database, but simply ignored in the current context.
Most of the other sub-tasks in Data mode (eg. Save, Print, Map, Report) will respect the filter criteria when displaying or processing records.
The Record filter form
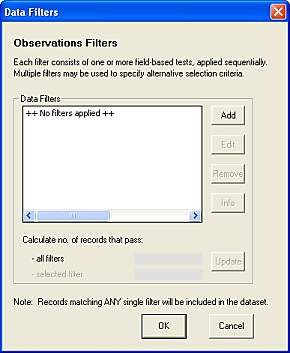
The Filter records subtask button opens the 'Data Filters' form, which allows you to apply field-based filter criteria to the table contents.
The Data Filter tool is common to a number of processes in FieldNotes - see the Data Filters help pages for more information about its use.
2.4 Copying Worksheet data
The Copy subtask button copies the selected record information to the clipboard.
You can paste the clipboard data into many text-editors using CTRL+V (control and V keys).
2.5 Saving Worksheet data
The Save subtask button saves the records currently displayed in the worksheet window (ie. observing any filter constraints on the worksheet contents) as a file in one of the following formats:
-
CSV (comma-delimited) - output one record per line, with each field separated by a comma.
-
Text (tab-delimited) - output one record per line, with each field separated by a tab character.
-
Formatted text (space-delimited) - output one record per line, with each field separated by a space character.
-
Web page (HTML) - output in HTML format as a simple web-page, containing the selected records (as a table) with an explanatory header.
2.6 Printing Worksheet data
The Print subtask button prints the records currently displayed in the worksheet window (ie. observing any filter constraints on the worksheet contents).
2.7 Creating a Map from the Worksheet data
The Map subtask button plots the records currently displayed in the worksheet window (ie. observing any filter constraints on the worksheet contents) as a map.
After the map is created FieldNotes switches to Map mode to display the map.
A worksheet-based map.
See the FieldNotes Map mode help pages for further information about mapping data.
2.8 Creating a simple Report from the Worksheet data
The Report subtask button generates a simple (list-style) report from the records currently displayed in the worksheet window (ie. observing any filter constraints on the worksheet contents).
The report is displayed in a separate window.
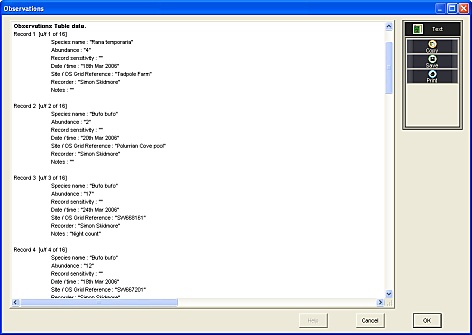
A simple worksheet-based report.
The entire report (or selected portions of it) may be copied to the clipboard, saved to a file or printed using the relevant taskbar buttons.
The report is simple formatted (ascii) text.
The fields included in the report depend on the Level-of-detail setting used when creating the report - for best results choose the same Level-of-detail used for data-entry.